
I’ll follow up tomorrow with a round-up of all the final polls and projections but for now, here’s the running average. For those just tuning in, I assign weights to all polls based on sample size, the polling company’s track record on Canadian elections over the past 6 years, and the recency of the data:
CPC 36.5%
NDP 29.9%
Lib 21.3%
BQ 6.6%
Green 4.9%
Keep in mind, the Conservatives exceeded their final poll numbers by 2-3 percentage points in 2008. Whether or not that happens again remains to be seen, but they do have the best ground game and the most incumbent candidates. Their vote also tends to be older and, I suspect, is more likely to turn out at the polls. But that’s all conjecture on my part – the exercise here is to make projections using the data on hand.
Using the vote numbers above, I’ve simulated the election 10,000 times. These simulations factor in results from the past 3 elections, the demographics of each riding, by election results, and incumbency advantages. Each simulation looks at how regional shifts traditionally transfer to the riding level – after all, if the NDP vote jumps from 12% to 36% in Quebec, it doesn’t mean their vote will increase by 24 points in every riding…and it doesn’t mean their vote will triple in every riding. This is why the simulation model is, in my humble opinion, superior to all other models out there. It doesn’t say the Tories will win a given seat – it only says they have a 70% chance of winning a given seat.
Finally, when running the simulations, I also consider the fact that the polls could simply be off the mark, as they have been in some recent elections.
For the long and boring explanation of this methodology, click here.
So, with that said…drumroll please…
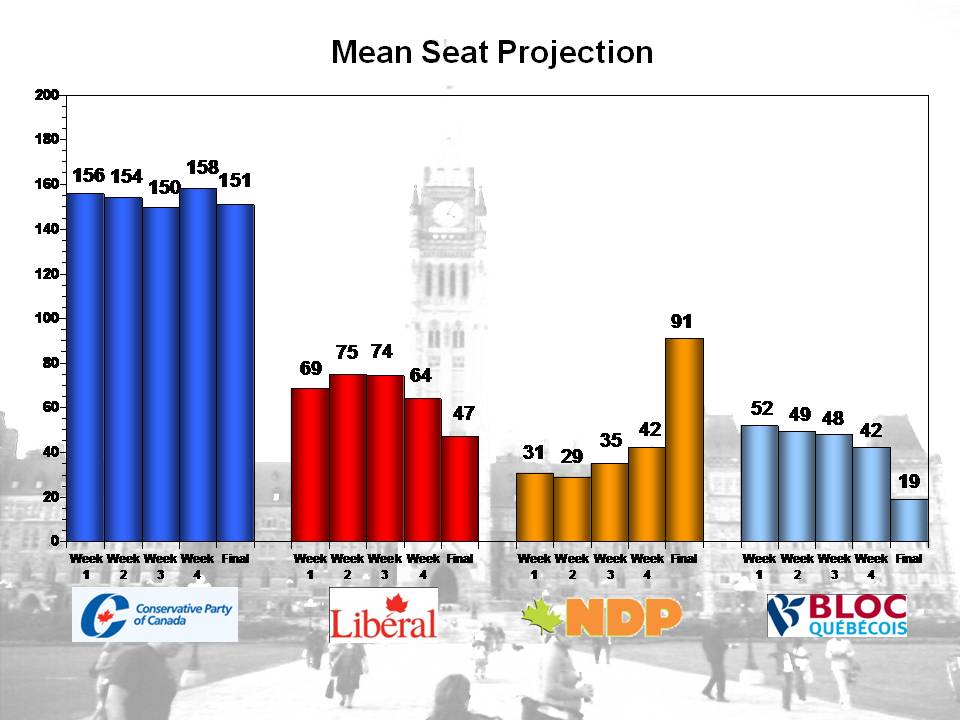
CPC: 139 to 163 seats (mean: 151.0)
NDP: 76 to 106 seats (mean: 90.9)
Lib: 35 to 58 seats (mean: 46.9)
BQ: 9 to 30 seats (mean: 18.5)
Ind: 0.6
I would love to tighten some of those confidence intervals up, but the reality is this is as close to certain as we can be given the public polling data on hand. Quebec is a complete wild card this election, since there isn’t a projection model out there capable of saying what a 30-point jump in NDP support actually means in terms of seats.
All 10,000 simulations had the same order of the parties, with the Conservatives winning a majority 28% of the time. So we may have to stay up late to see whether or not Harper gets that long sought after majority…or at least is close enough to “top it up” with a few floor crossers.
Now, what I like about this simulation model is that it’s 100% data driven. I haven’t arbitrarily decided who is or isn’t a star candidate, or tweaked the model to get the results I want. So like all seat projection systems, it should be used as a tool to make predictions, not as a prediction in and of itself.
This is why I’ve spent the weekend going riding by riding (Atlantic, Quebec, Ontario, Prairies, Alberta, BC). Based on what the model is projecting and what the individual ridings look like, I’m going to stand by the prediction I made on James Bow’s blog yesterday:
CPC 146
NDP 83
Lib 55
BQ 22
Green 1
Ind 1
I may be wrong, and that’s cool if I am. It wouldn’t be the first time. By all means, make your own predictions below, and I’ll be sure to give a special shout out to whoever is closest to the mark.