Despite some mid-week adventures by Nanos, the poll numbers stayed relatively flat in Week 1 of the campaign. In effect, outside of our daily dose of Nik, there wasn’t a lot to report on until Ekos and Leger rolled in over the weekend. (We also got new numbers from Decima today, but only after I ran my seat projections)
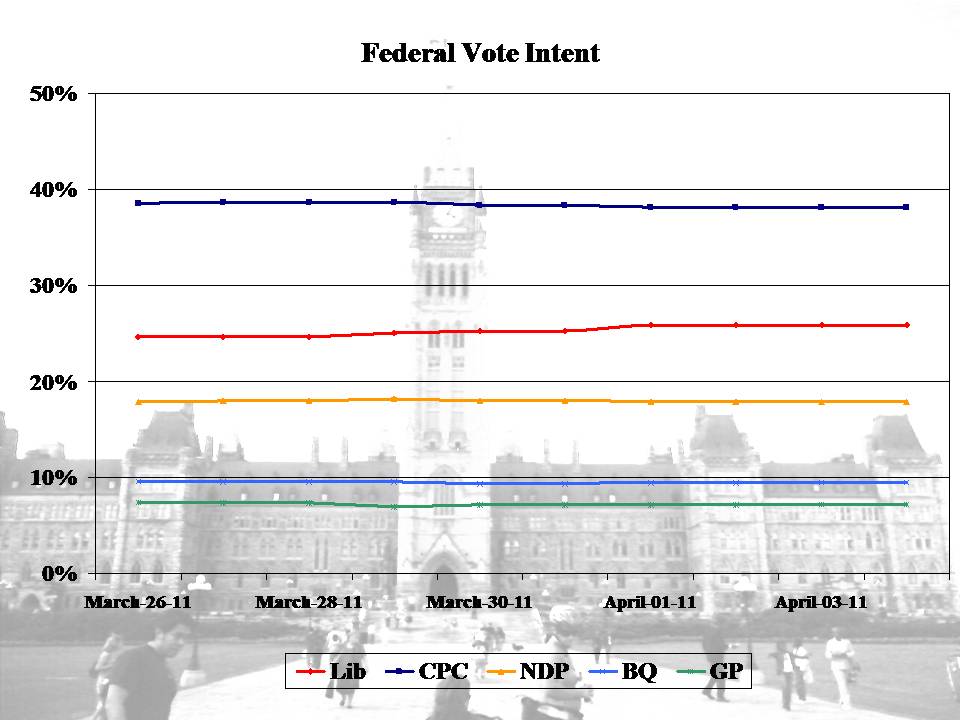
The end result, is a vote line as flat as Saskatchewan.
As a bit of context, the graph above gives a daily popular vote average from on all publicly released polls, based on:
-How recently the polls were conducted. Each poll is given a one-week half-life which meaning a poll released today is worth twice as much as one released a week ago. I consider a poll “added” to the sample on the mean day it was in field (i.e. night 2 of a 3 night field).
-Poll sample sizes
-The accuracy of each company’s election polls over the past 5 years
From this, I ran my seat projection model. For the lengthy methodology, click here. The key thing to keep in mind is this model simulates the election 10,000 times in every riding – in each simulation, I include 3 sources of variance:
1) The variance between regional shifts and riding shifts observed in the 2004, 2006, and 2008 elections (i.e. if the Liberals are up 5 points in Ontario, how can we expect their vote to swing in a given riding?)
2) Sample variance, based on the sample size of the polls being used
3) “Pollster variance”, based on how much polls have missed the mark in recent campaigns, beyond the sample variance
The model also takes by elections and incumbency into account. And unlike other models, it includes not only the 2008 election as the baseline, but some 2004 and 2006 election results, as well as a riding projection based on demographics. This helps “smooth” out anomalous results from the 2008 campaign, to ensure we don’t project the Greens winning Central Nova or anything like that.
What I want to stress is that this model is completely data-driven. At no point have I “tweaked” the results, or given boosts to individual candidates. Once you start doing that, you might as well just consult the Election Prediction Project.
Also, when calculating variance numbers, by election effects, and incumbency effects, the numbers I’m using are based 100% on research I’ve conducted (using 2004 and 2006 data to simulate the 2008 election). No factor (outside of the 7-day polling half life) has been arbitrarily picked.
OK – I guess that short explanation turned into a long one. I’ll keep it brief on further updates. One final disclaimer – this is not a prediction of how the election will turn out. It’s based on the poll numbers released as of today…poll numbers that reflect a relatively unengaged electorate.
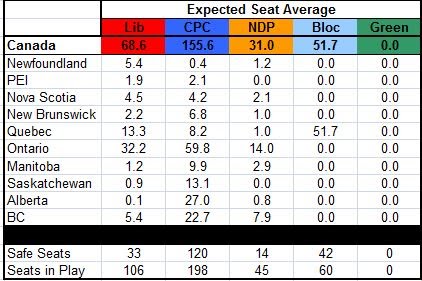
And with that, here’s what’s projected: 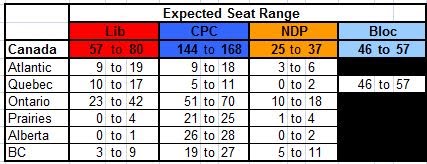
Based on the simulations, Harper sits at a 56.5% chance of a majority.
Mind you, this actually reflects a drop in support from him from my final pre-election simulation, which pegged him at between 148 to 178 seats. So the gap did narrow a bit in week 1, but it’s still a big gap.
Then, as now, Harper’s gains have come almost exclusively in Ontario. The lower end of that 95% confidence interval for Ontario is 51 seats – that’s the toal he got last election, and he could gain up to 19 more. In every other province, Harper’s expect seat total is within 1 or 2 of his total last election.
Again, it’s too early to consider this anything more than a fun statistical exercise. But, based on these numbers, it’s a lot more fun for Conservatives than Liberals.