For those who recall, I experimented with a seat projection model last election.
By and large, it worked as well as any of the other models out there. But the rub is, my model, like every other pundit, seat projection and octopus out there, underestimated the Conservative seat total and overestimated the Liberal one. The reason? The Conservatives over performed their polling numbers at the ballot box.
And that’s the problem with the seat projection game – it’s only as good as the polling data it uses. I think I’ve found a way to work around this, although I’m sure some tweaking will be required. But for now, I’m quite pleased with the model I’ve produced.
To read the big and long methodology behind it, click here. The short version of it is this: the model projects seats, taking the following into account:
-Publicly released polling data
-2004, 2006, and 2008 election results
–Riding demographics
-The historical variance in riding results, compared to regional results
-Accuracy of Canadian pollsters in predicting recent provincial and federal elections
–Incumbency
–By election results
For all these factors, I’ve done quite a bit of trial and error research – usually using the ’04 and ’06 elections to “project” the ’08 one. The end result is a projection system that has a few key advantages:
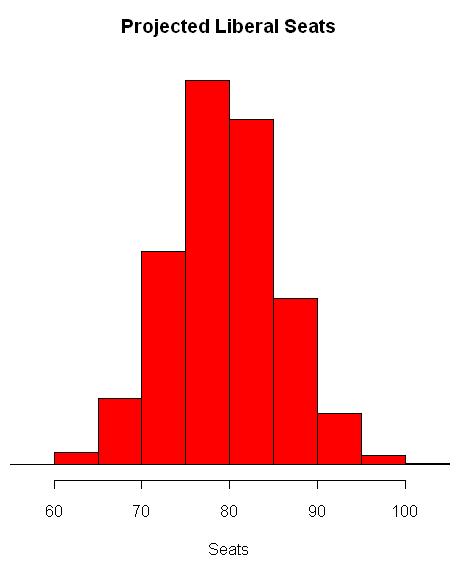
1. It has built in safeguards against “election day swing”, when certain parties over or under perform all the polls. It’s no use pretending this doesn’t happen, so it should be reflected in projection models, especially ones which rely on simulations. This may not make my “best guess” any more accurate, but it makes the model far more adept at calculating the probability of things like a Liberal win, or a Tory majority.
2. It’s robust. By looking at the past three elections and the riding demographics, this model smoothes out some of the fluky results that tend to plague seat projection models due to “weird stuff” like Elizabeth May running in Central Nova or surprise nudity.
3. It’s entirely objective. I plug the numbers into my excel sheet, run some simulations in R, and get the output.
4. It produces a probability in each riding. Most projection models that show the Liberals up by 1% in a riding will project the riding to go Liberal – in reality, if the Liberals are projected to be up by 1%, it really means you might as well flip a coin to pick the winner.
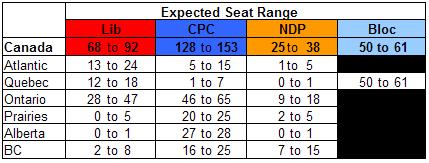
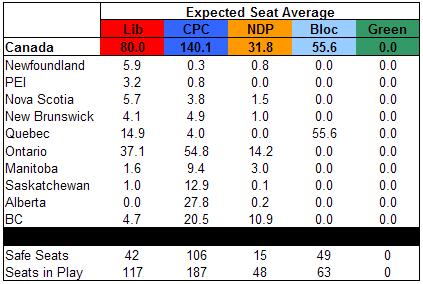
So, if you want the long explanation, click here. Otherwise, here are my projections, based on polling data released in June and July. Remember, this is what would happen if the election were held today – it’s not a prediction of what would happen if the election were held in a few months. Campaigns matter.
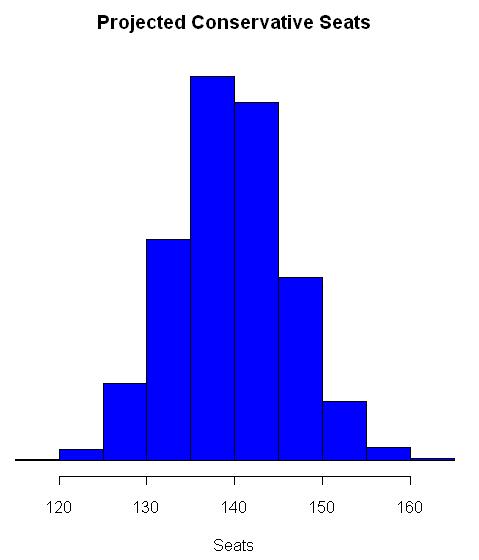

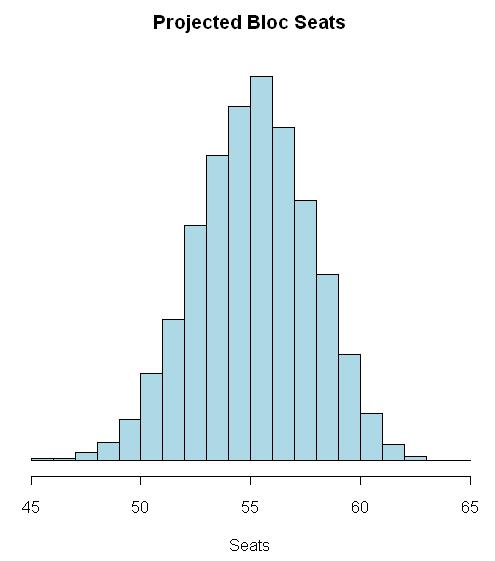
Probability of Conservative Win: 100%
Probability of Conservative Majority: 1.6%