Since 538 rocks my world, I figured it might be fun to try something similar for the federal campaign, so I’ve developed a seat projection system that uses a probabalistic approach. Here’s the explanation, in as plain English as I could put it. Feel free to e-mail me or ask for clarification in the comments section – I’m open to suggestions for improvements:
1. I’ve collected all the publicly available polling data released since September 1st (Nanos, Leger, Segma, Environics, Ipsos, Angus, Decima, SC, and CROP). I’ve only included data where regional splits are available.
2. A weighted average of the data is calculated for each region, assuming a 3 day half life for polling data. What that means is that a 3 day old sample of 500 from Quebec is weighted equally to a 6 day old sample of 1000 from Quebec – both would be counted as 250 completes. The “days old” number is based on the middle night of polling.
3. At this point, each seat is projected based on the change in the region. So if the Liberals are up 10% in Alberta (ha ha ha), they get 10% added to each seat. Sort of. In order to make the model more realistic, I’ve weighted the “base” for each seat 3/4 from 2006 and 1/4 from 2004, to reflect any “bizarre” fluctuations that may have happened last election due to local candidates, etc. I’ve also made a correction for incumbents retiring (between 2004 and 2006, the “incumbency factor” was worth 4.1% once regional changes were controlled for). And, in ridings where a by election has been held, I’ve given the by election and last election equal weighting. The important thing to remember is that, even after all this, everything gets projected to the regional numbers. So regardless of the tweakings, the numbers projected in Atlantic Canada will match the polling data.
4. And I could quit at this point and just list the projected wins and loses. But the problem with that is that a projected 2% Liberal win counts as 1 Liberal seat, as does a 30% projected Liberal win. And when you consider all the error associated with these projections, the two are definitely not even. So I decided to go the simulation route.
So I ran 1000 simulated elections. In each one, the regional numbers were simulated based on the sample size for the region (using the half-life discussed above). And then each riding was given a “random shift” based on the “regional to riding variance” observed when I ran this same model on the 2006 election using 2004 data (standard error of about 4% for each riding).
So in each of these 1000 elections I’ve got a winner in every riding. That means I can project a “probability of victory” for each seat, and get an average number of seats won per party.
It should be noted that this is all assuming the election is held today…I’m not predicting future shifts in popular support. It’s also assuming the polling numbers are accurate. And it’s not going to take into account a lot of the “unique” riding dynamics (Bill Casey, Lizzie May, etc) or different shifts that might be occuring between, say, Vancouver and rural BC.
So, based on the simulations, here are the results and graphs:
National
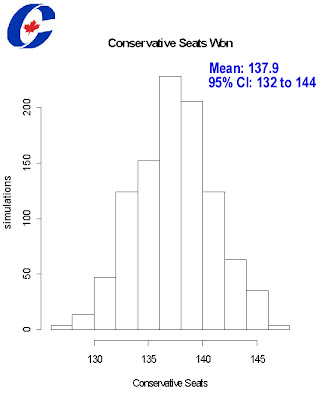
Conservatives: 137.9 (95% CI from 132 to 144)
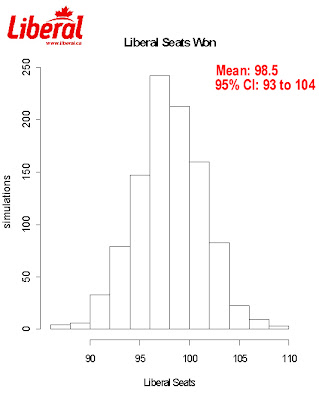
Liberals: 98.5 (95% CI from 93 to 104)
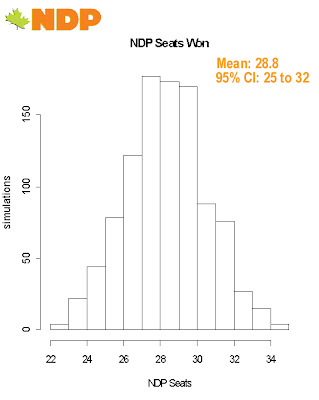
NDP: 28.8 (95% CI from 25 to 32)
Bloc: 42.0 (95% CI from 39 to 45)
Indepent: 0.8 (Andre Arthur is the only independent who’s going to show up on this model and, regardless of whatever the projections say, he’s pretty much a lock since the Tories aren’t challenging him)
It should be noted that, up until a few days ago when the Decima and Nanos polls rolled in, this model was projecting a high probability of a Tory majority.
Here are the regional breaks:
Atlantic Canada
Liberal: 22.2
Conservative: 6.5
NDP: 3.3
Quebec
Bloc: 42.0
Liberal: 16.0
Conservative: 15.4
NDP: 0.8
Ind: 0.8
Ontario
Conservative: 51.4
Liberal: 44.3
NDP: 10.2
Prairies
Conservative: 19.4
Liberal: 4.7
NDP: 3.9
Alberta
Conservative: 27.7
Liberal: 0.3
BC + Territories
Conservative: 17.4
Liberal: 11.0
NDP: 10.6

See Also: Barry Kay Projections, Hill and Knowlton Projector, UBC Election Stock Market